- Solutions
Solutions
Our solutions verify the value and opportunities in data modernization, with industry-leading technologies, low investment overhead and proven support.
- By Industry
- Financial Services
- Healthcare
- Higher Education
- Highline Accelerators
- Highline Accelerators Overview
- Talend Cloud Highline
- Snowflake Highline
- GrowthLoop Highline
- Data Rocket®
Data Rocket®
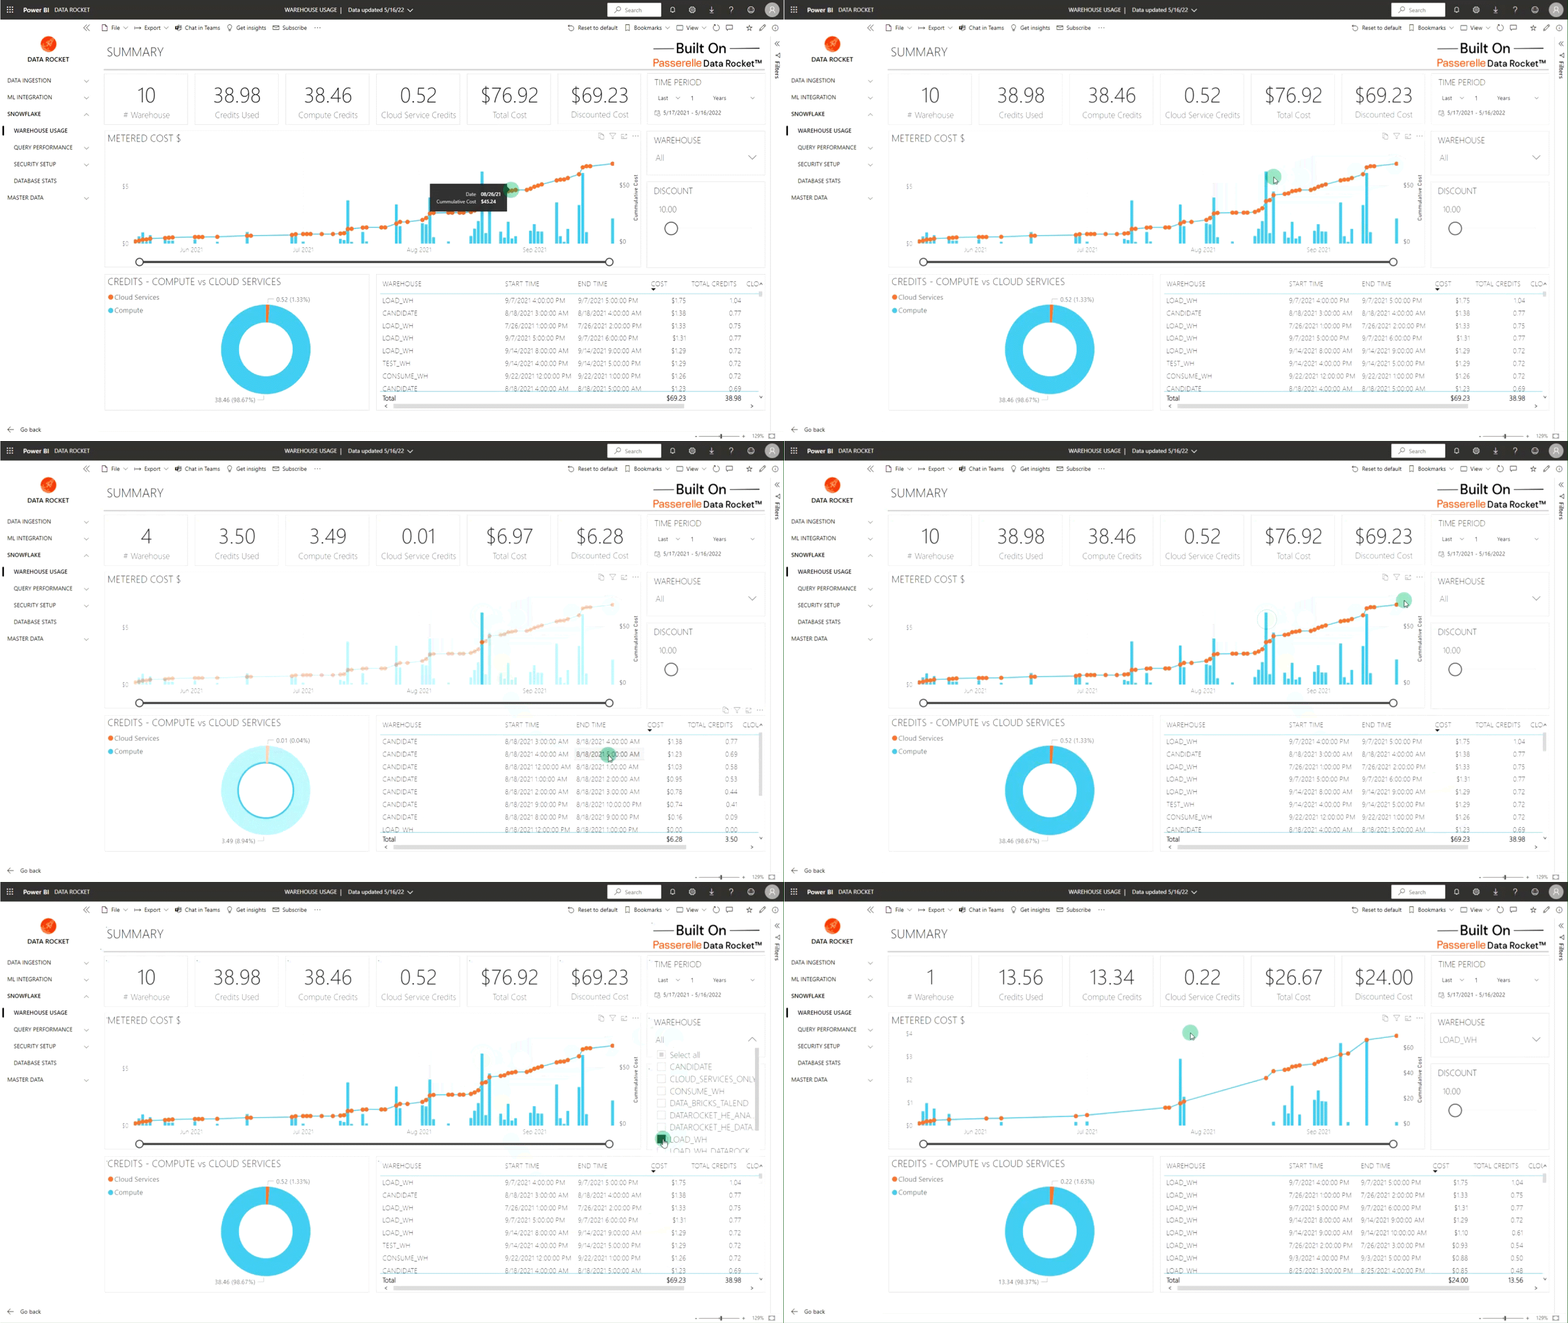
Data Rocket® helps organizations turn data to action by modernizing infrastructure and delivering critical business insights - securely and accessibly. Data Rocket puts industry-best data technology in the hands of businesses of any size, unlocking dynamic ingestion, data mastering, 3rd party data, and ML and AI applications.
- Partners
Partners
Passerelle partners with technology providers that demonstrate an ability to deliver positive outcomes to our clients - efficiently and at scale. Our Keystone Partners provide the foundational technology for our product offerings. Featured Partners are best in class data solutions for visualization, enrichment, data science and security. Interested in joining our partner ecosystem? Contact us today.
- Featured Partners
- GrowthLoop
- Atlan
- dbt Cloud™
- Equifax
- Resources
Resources
Ready to start your digital transformation? Learn how technology leaders in banking, higher education, manufacturing, healthcare and energy are turning Data to Action with the help of Passerelle engineering and solutions.
- Customer Stories
- Case Studies
- Video Testimonials
- Banks and Credit Unions
- Guide | Modernization for Banks and Credit Unions
- Guide | Find Value in AI Today
- Guide | Three Steps to Modernization in Snowflake
- Guide | From Merger to Momentum – Data Strategy and Growth By M&A
- Case Study | Camden National Bank
- Case Study | Metro Credit Union
- Post | Digital Transformation During M&A
- About Us
About Us
We support the goals and objectives of companies that want to harness data to create better customer experiences, drive revenue growth, and respond to market demands.

